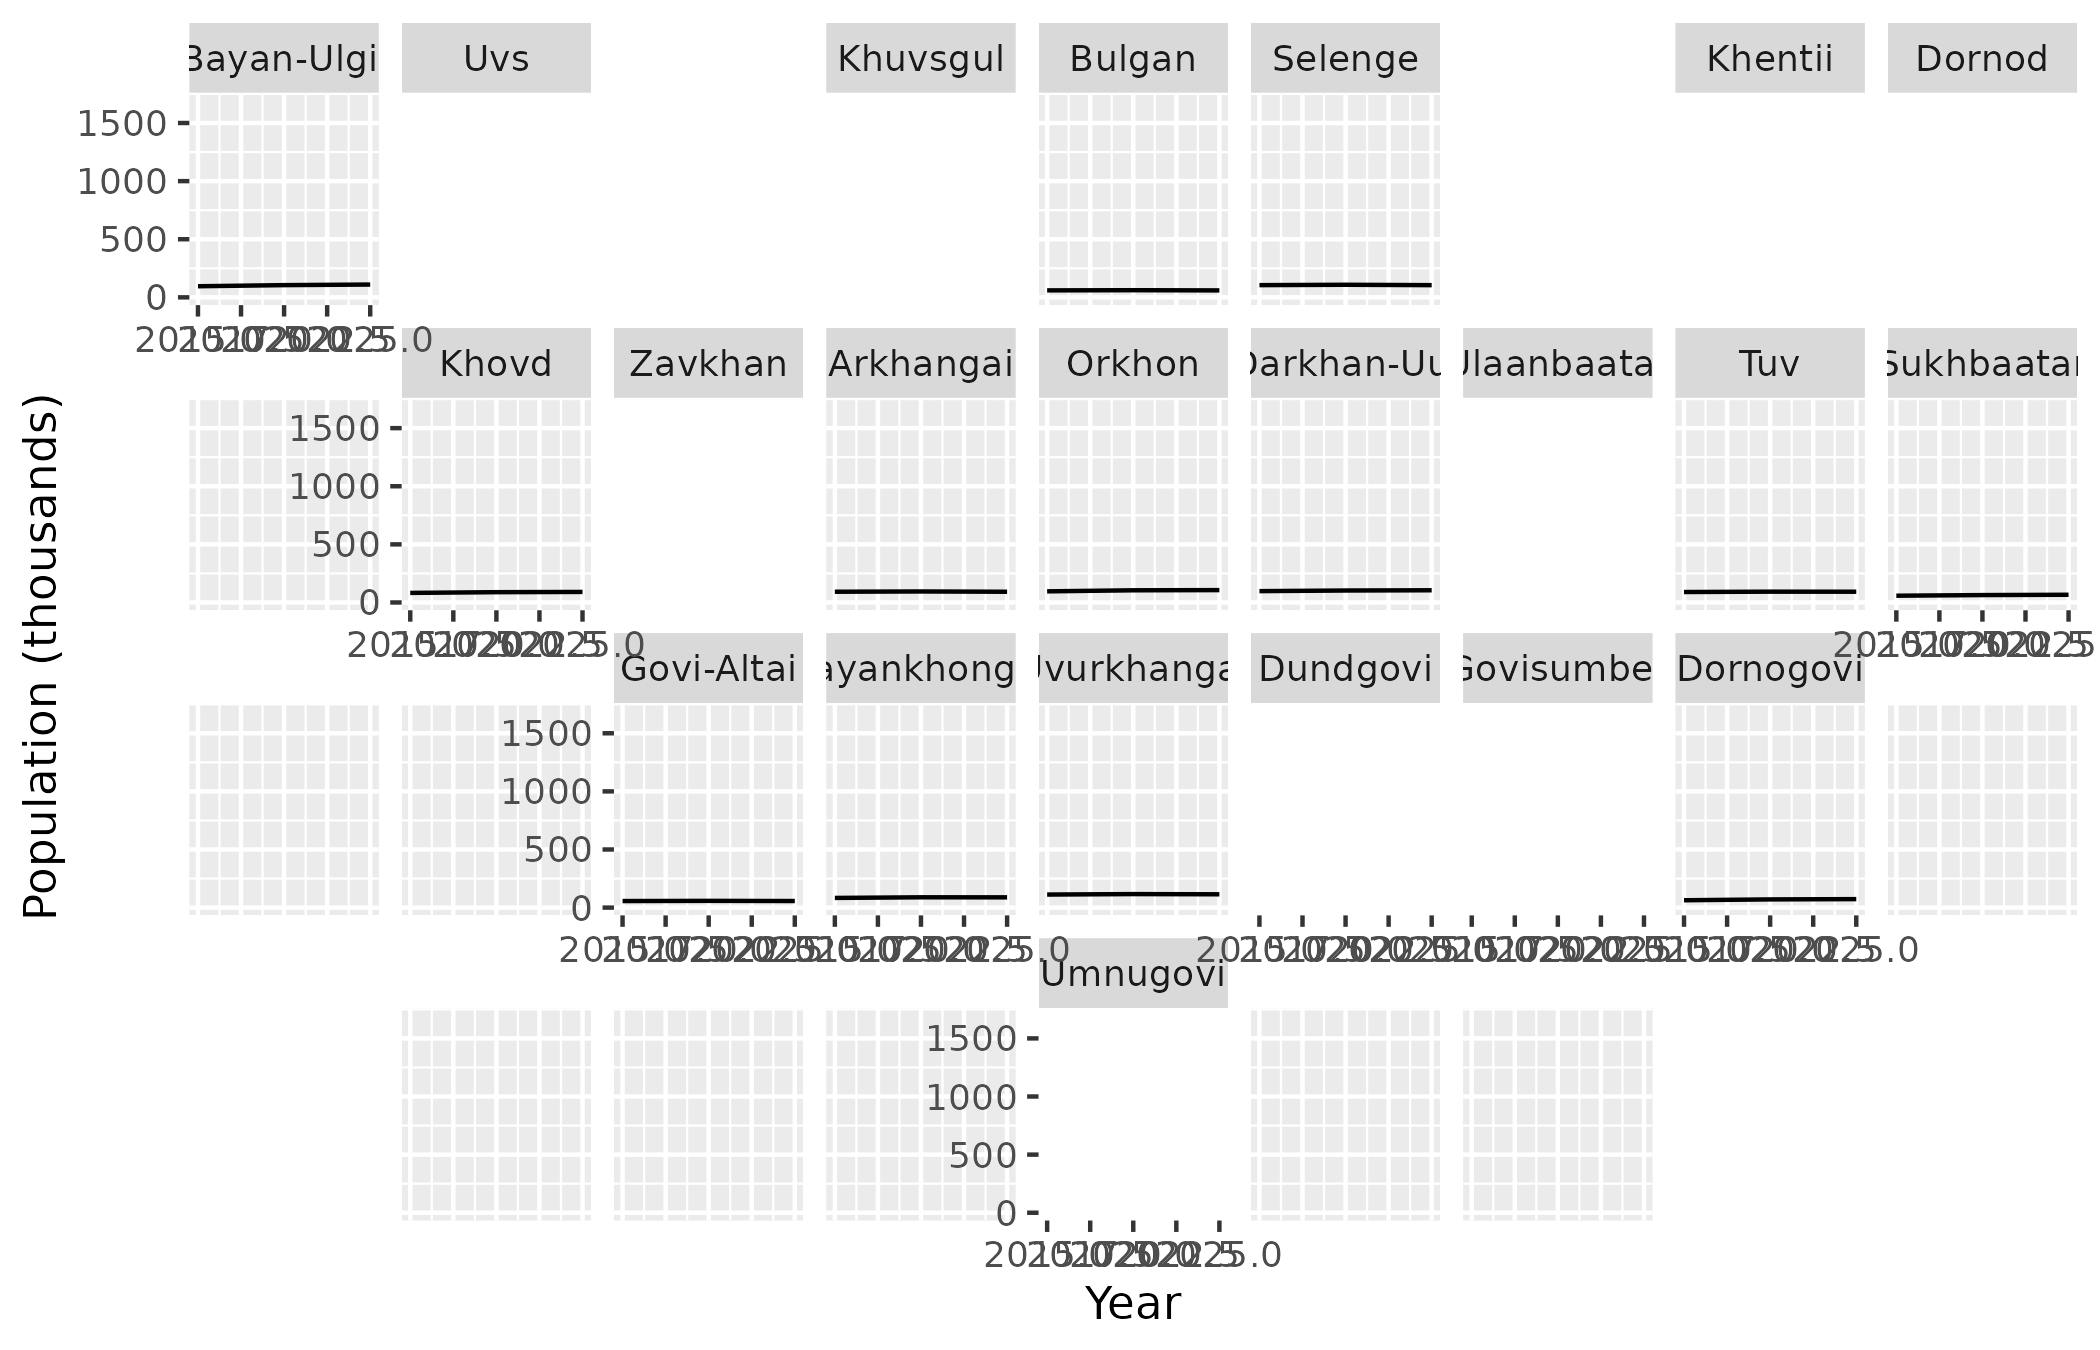
Positions of the 21 aimags and Ulaanbaatar on a 4-by-9 grid that keeps their rough geographic arrangement, in the format used by the geofacet package.
Format
A data frame with 22 rows and 4 columns: row, col, code
(the aimag pcode) and name (English name).
See also
Other mapping helpers:
mn_crs(),
mn_label_points(),
mn_leaflet(),
mn_map(),
theme_mn()
Examples
library(ggplot2)
pop <- mn_example_population[nchar(mn_example_population$Region) == 3, ]
pop$code <- mn_match(pop$Region)
ggplot(pop, aes(Year, value / 1000)) +
  geom_line() +
  geofacet::facet_geo(~code, grid = mn_aimag_grid, label = "name") +
  labs(y = "Population (thousands)")
#> Note: You provided a user-specified grid. If this is a generally-useful
#>   grid, please consider submitting it to become a part of the geofacet
#>   package. You can do this easily by calling:
#>   grid_submit(__grid_df_name__)