Draws any map from this package, or a map joined to your data, with sensible defaults: a projection suited to Mongolia, a colour-blind friendly palette, grey for missing values, optional labels and surroundings, and the data attribution as a caption. The result is a normal ggplot, so you can add layers, scales and themes to it.
Usage
mn_map(
  x = NULL,
  fill = NULL,
  trans = "identity",
  label = FALSE,
  context = FALSE,
  crs = NULL,
  lang = NULL,
  caption = TRUE,
  title = NULL,
  label_size = 2.6
)
Arguments
- x
An
sfobject, typically frommn_aimags(),mn_soums(),mn_khoroos()ormn_join(), or aterraraster such asmn_elevation(),mn_landcover()ormn_population(). Defaults to the aimags.- fill
Column to colour the polygons by (unquoted), or a single colour such as
"steelblue". Numbers get a continuous viridis scale; text and factors get a discrete one.- trans
Transformation of a numeric
fillscale, such as"log10"or"sqrt". Useful when Ulaanbaatar dwarfs everything else.- label
TRUEto label each unit with its name (khoroos with their number), or an unquoted column to label with.- context
If
TRUE, draws neighbouring countries, major rivers and lakes around the map.- crs
Projection.
NULLpicks one: Albers equal-area for the country or large parts of it, UTM zone 48N for Ulaanbaatar and other small areas in central Mongolia. Seemn_crs().- lang
Language of labels when
label = TRUE:"en","mn"or"mns".- caption
TRUEadds the data attribution frommn_citation();FALSEadds none; a string is used as is.- title
Optional plot title.
- label_size
Text size of labels.
See also
Other mapping helpers:
mn_aimag_grid,
mn_crs(),
mn_label_points(),
mn_leaflet(),
theme_mn()
Examples
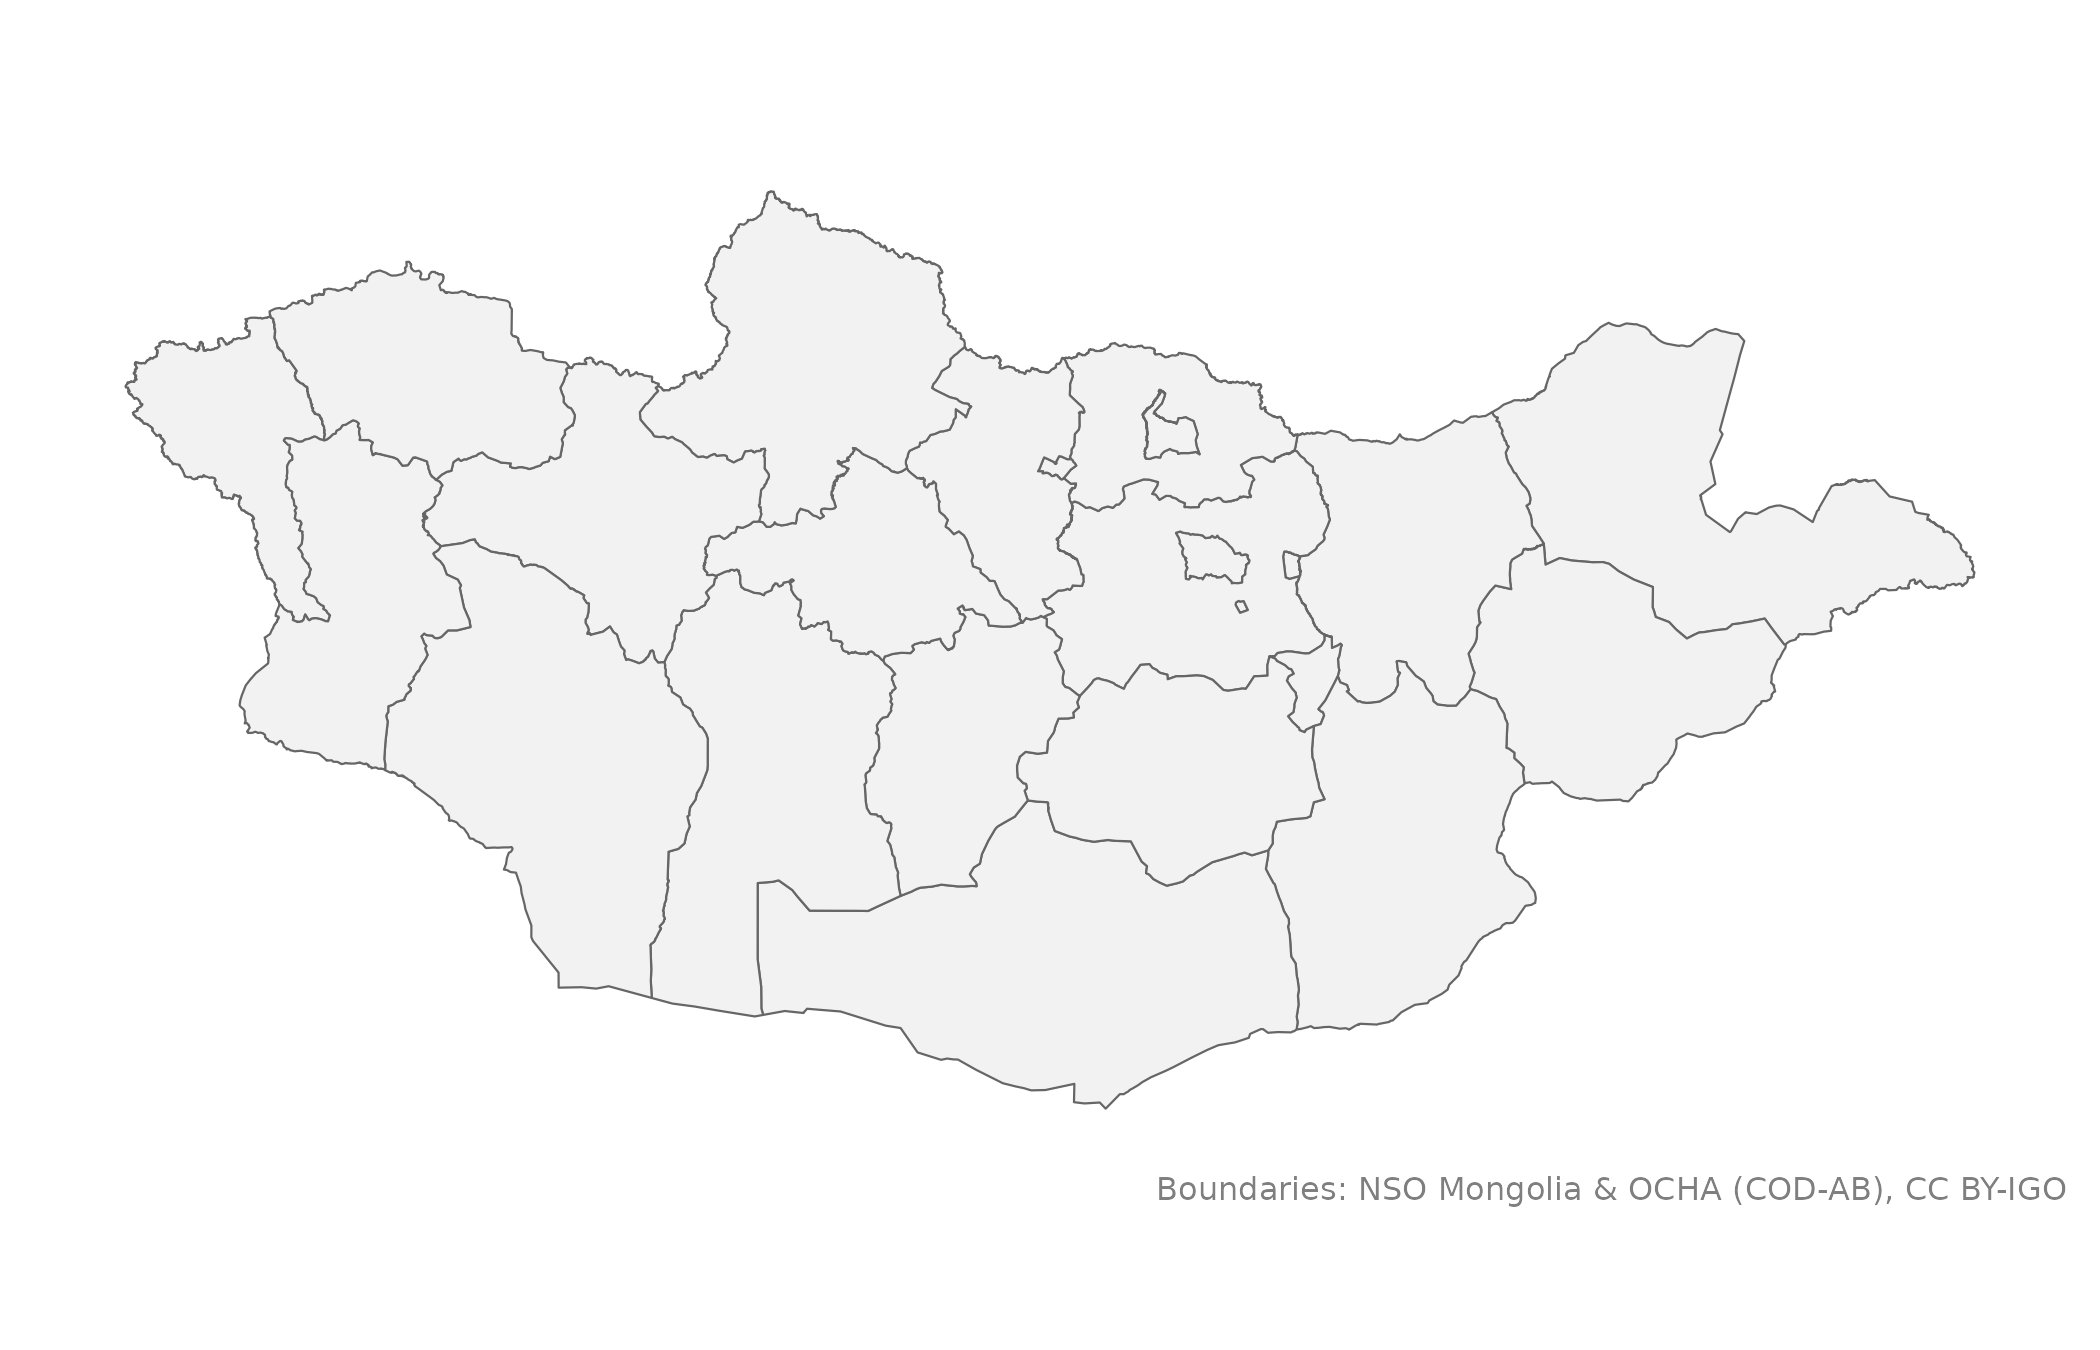
mn_map()
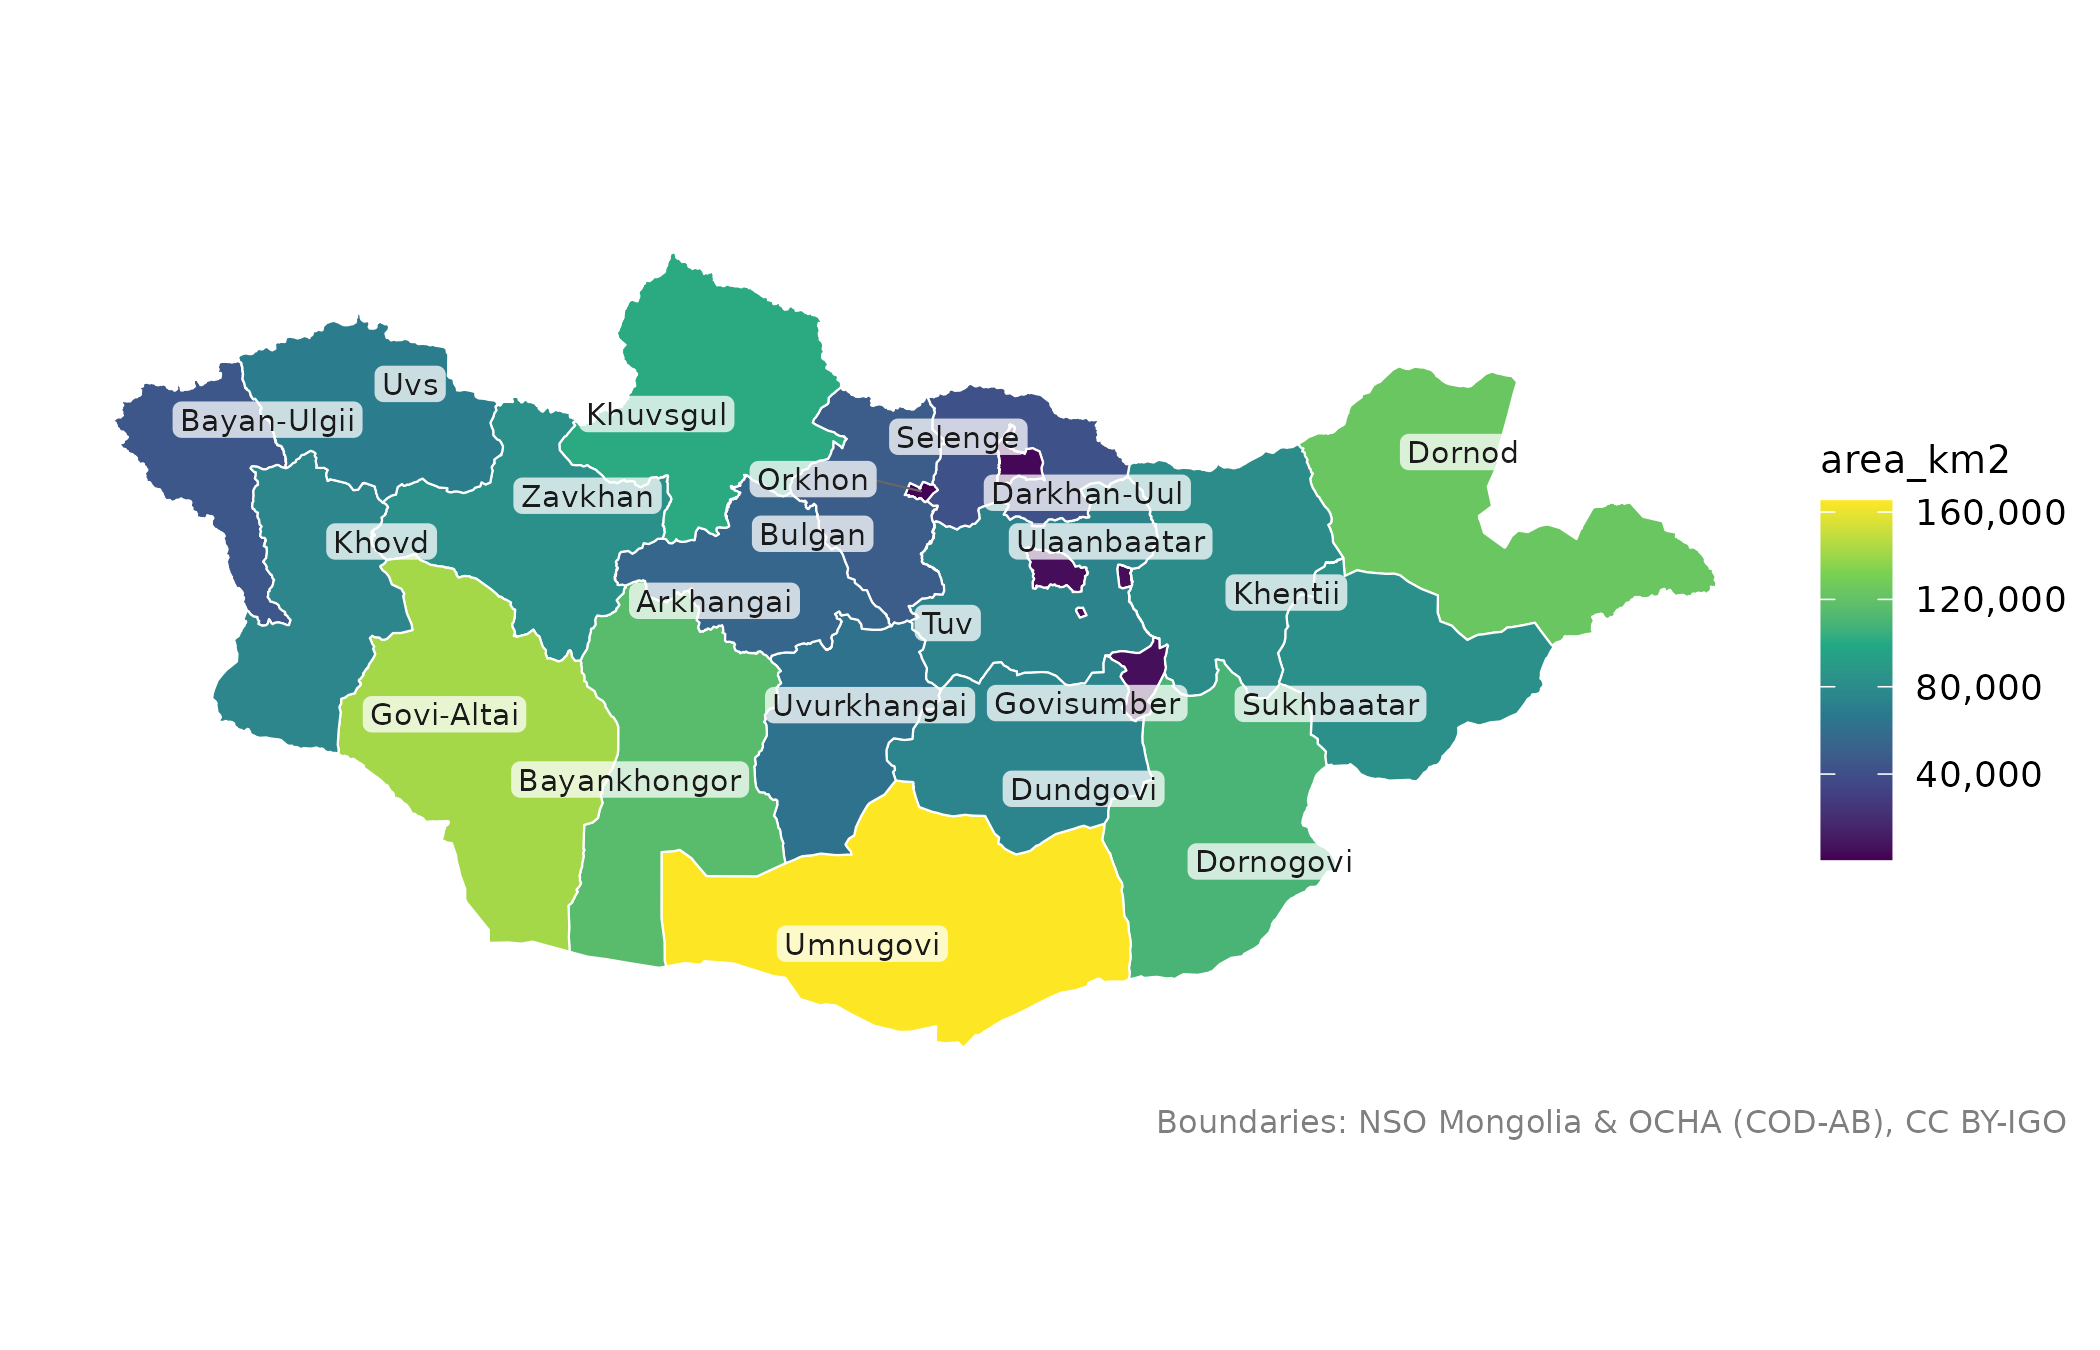
 mn_map(mn_aimags(), fill = area_km2, label = TRUE)
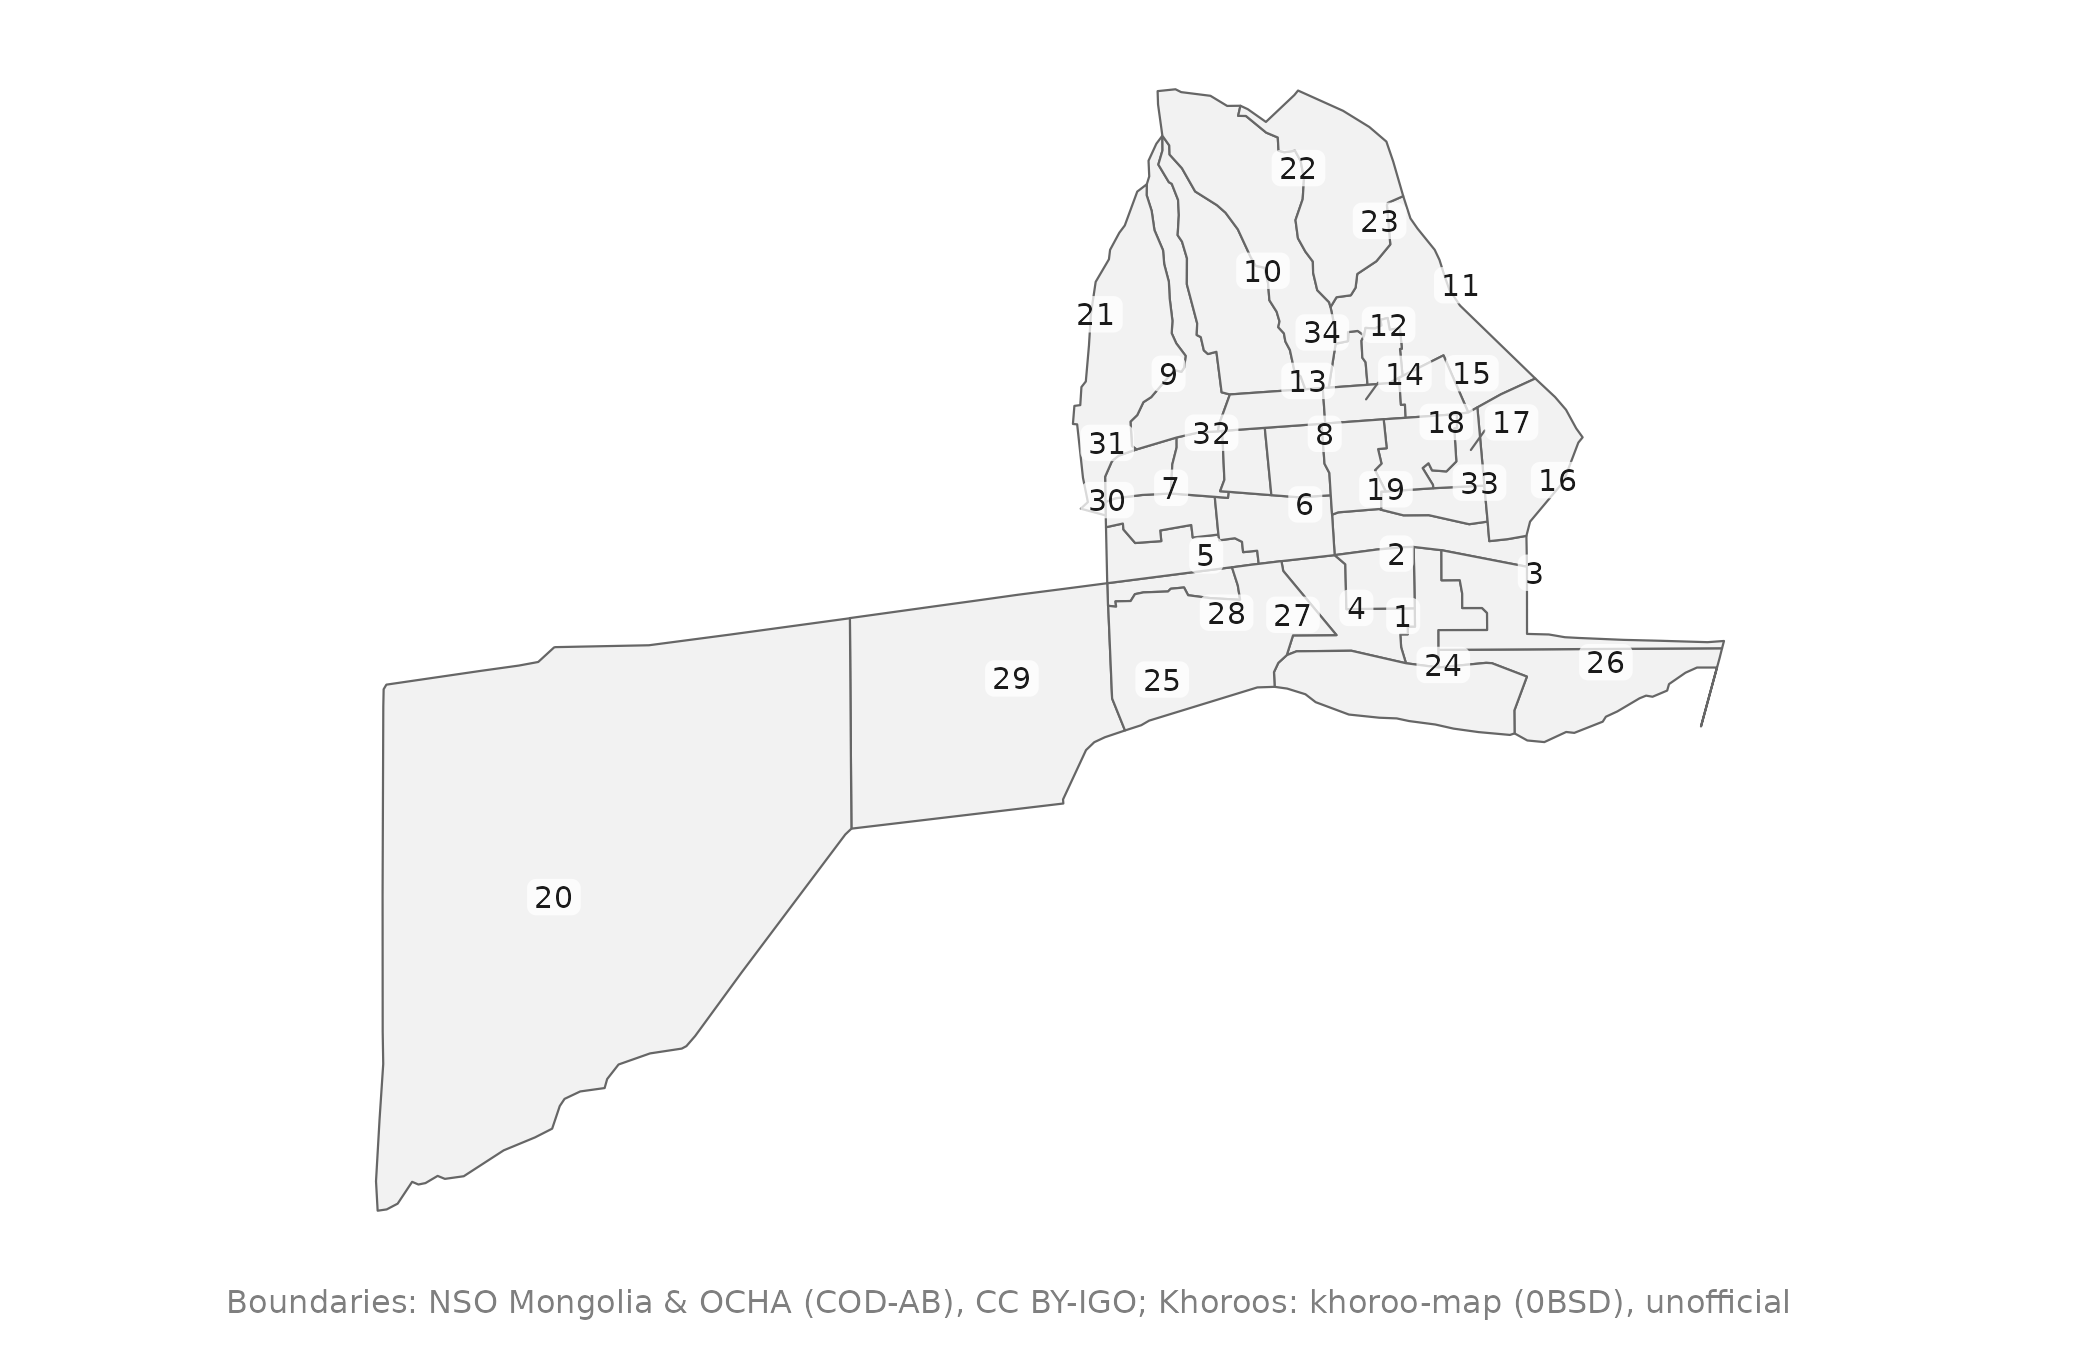
 mn_map(mn_khoroos(district = "Bayangol"), label = TRUE)
 pop <- mn_example_population[mn_example_population$Year == 2025, ]
pop_map <- mn_join(pop, "Region", level = "aimag")
#> ℹ Joining at the aimag level; dropped 6 rows for larger units ("country" and
#> "region") and 2196 rows for smaller units ("soum" and "bag").
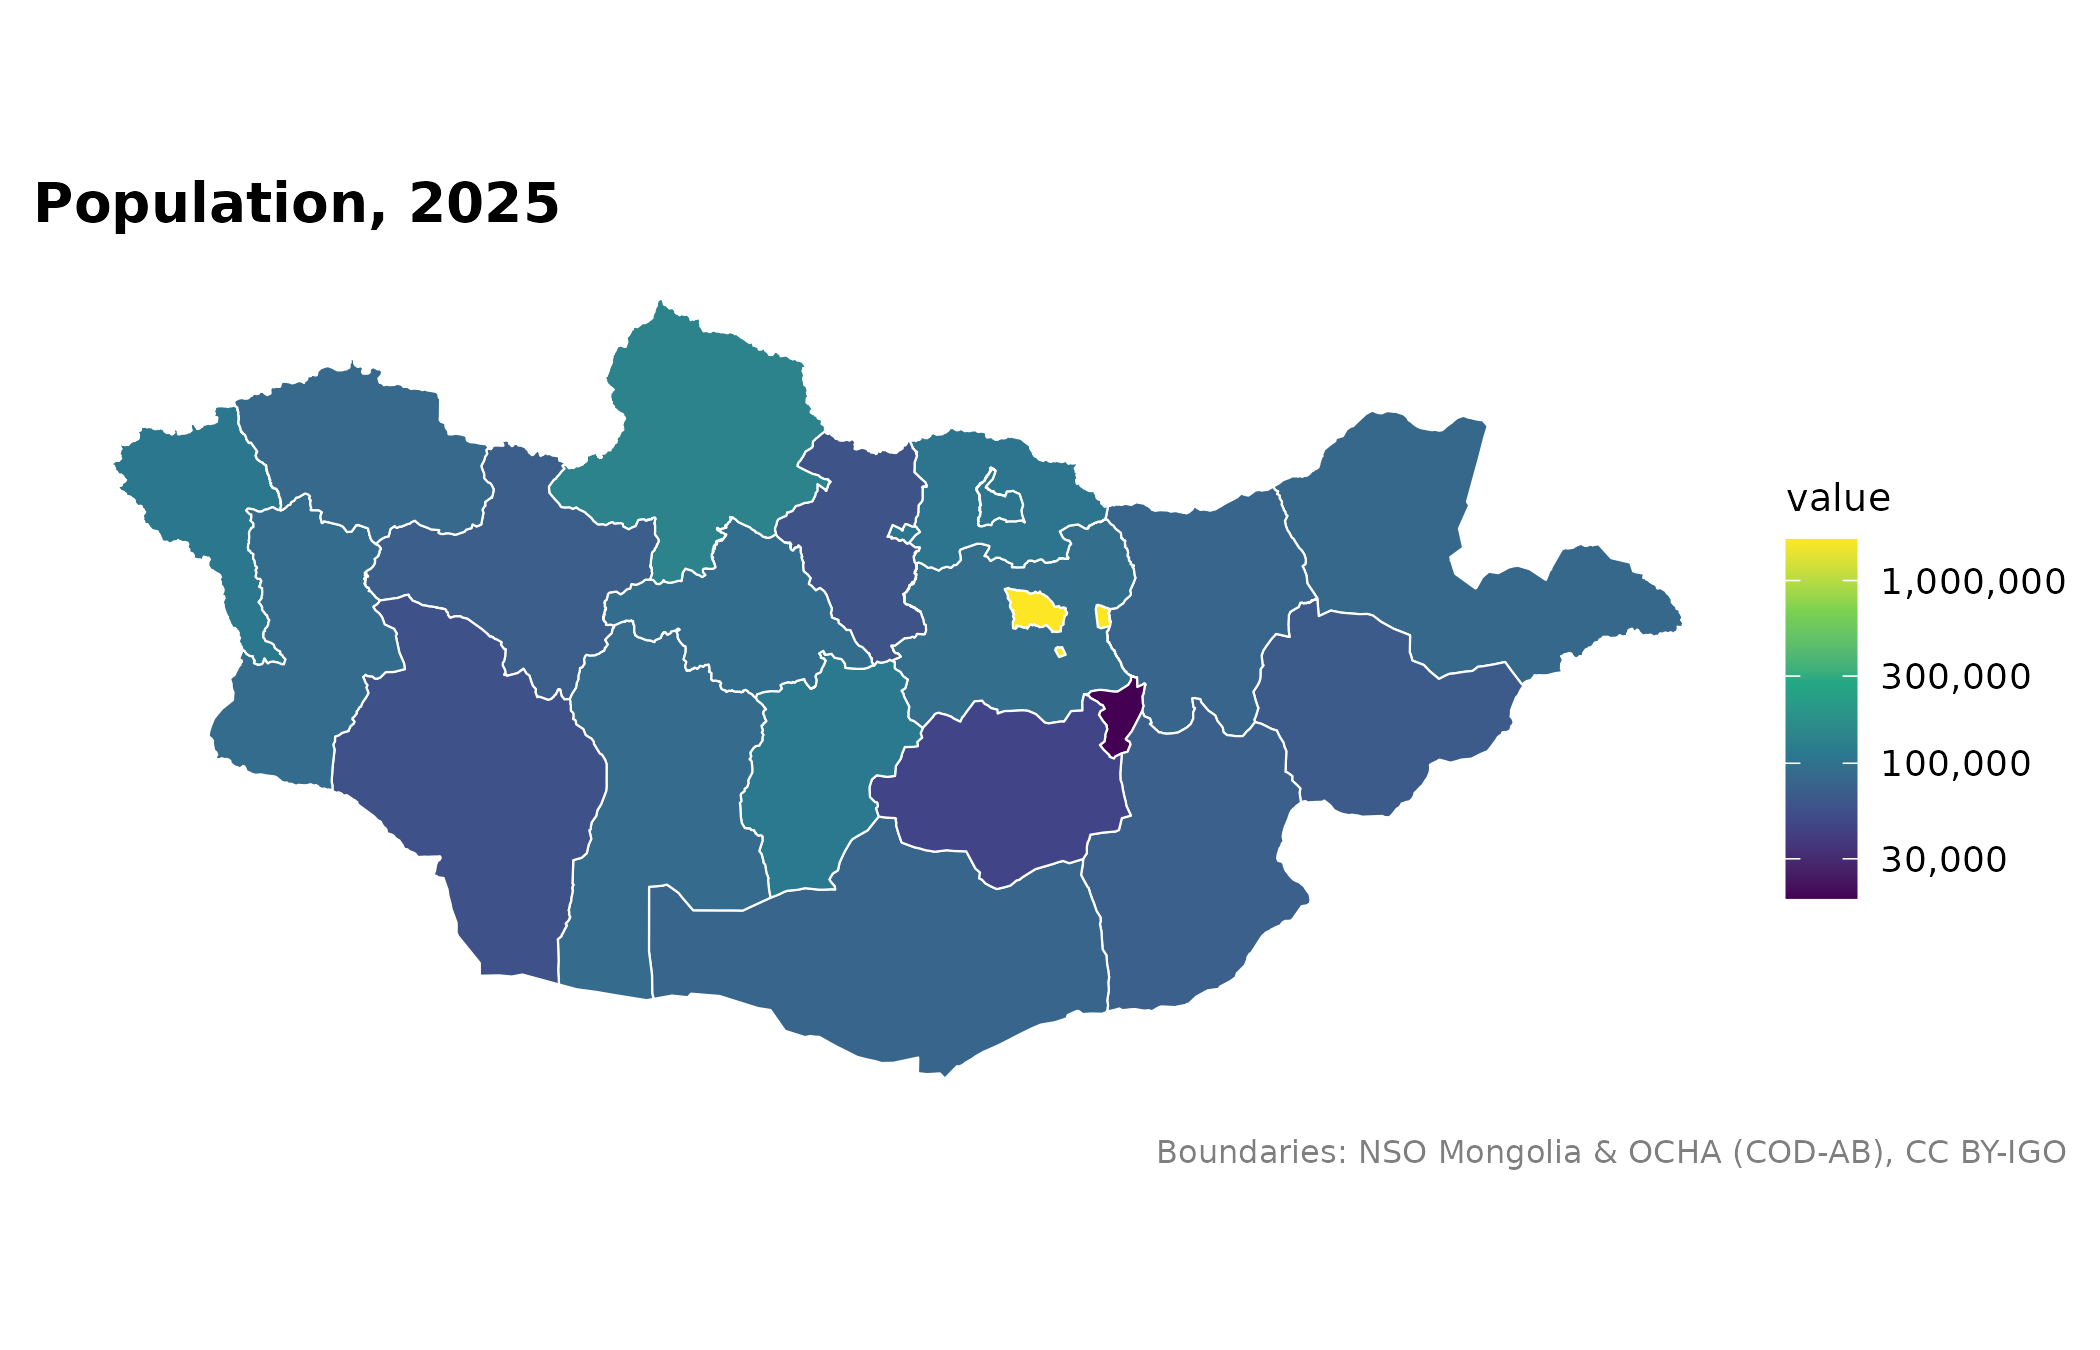
mn_map(pop_map, fill = value, trans = "log10", title = "Population, 2025")
pop <- mn_example_population[mn_example_population$Year == 2025, ]
pop_map <- mn_join(pop, "Region", level = "aimag")
#> ℹ Joining at the aimag level; dropped 6 rows for larger units ("country" and
#> "region") and 2196 rows for smaller units ("soum" and "bag").
mn_map(pop_map, fill = value, trans = "log10", title = "Population, 2025")
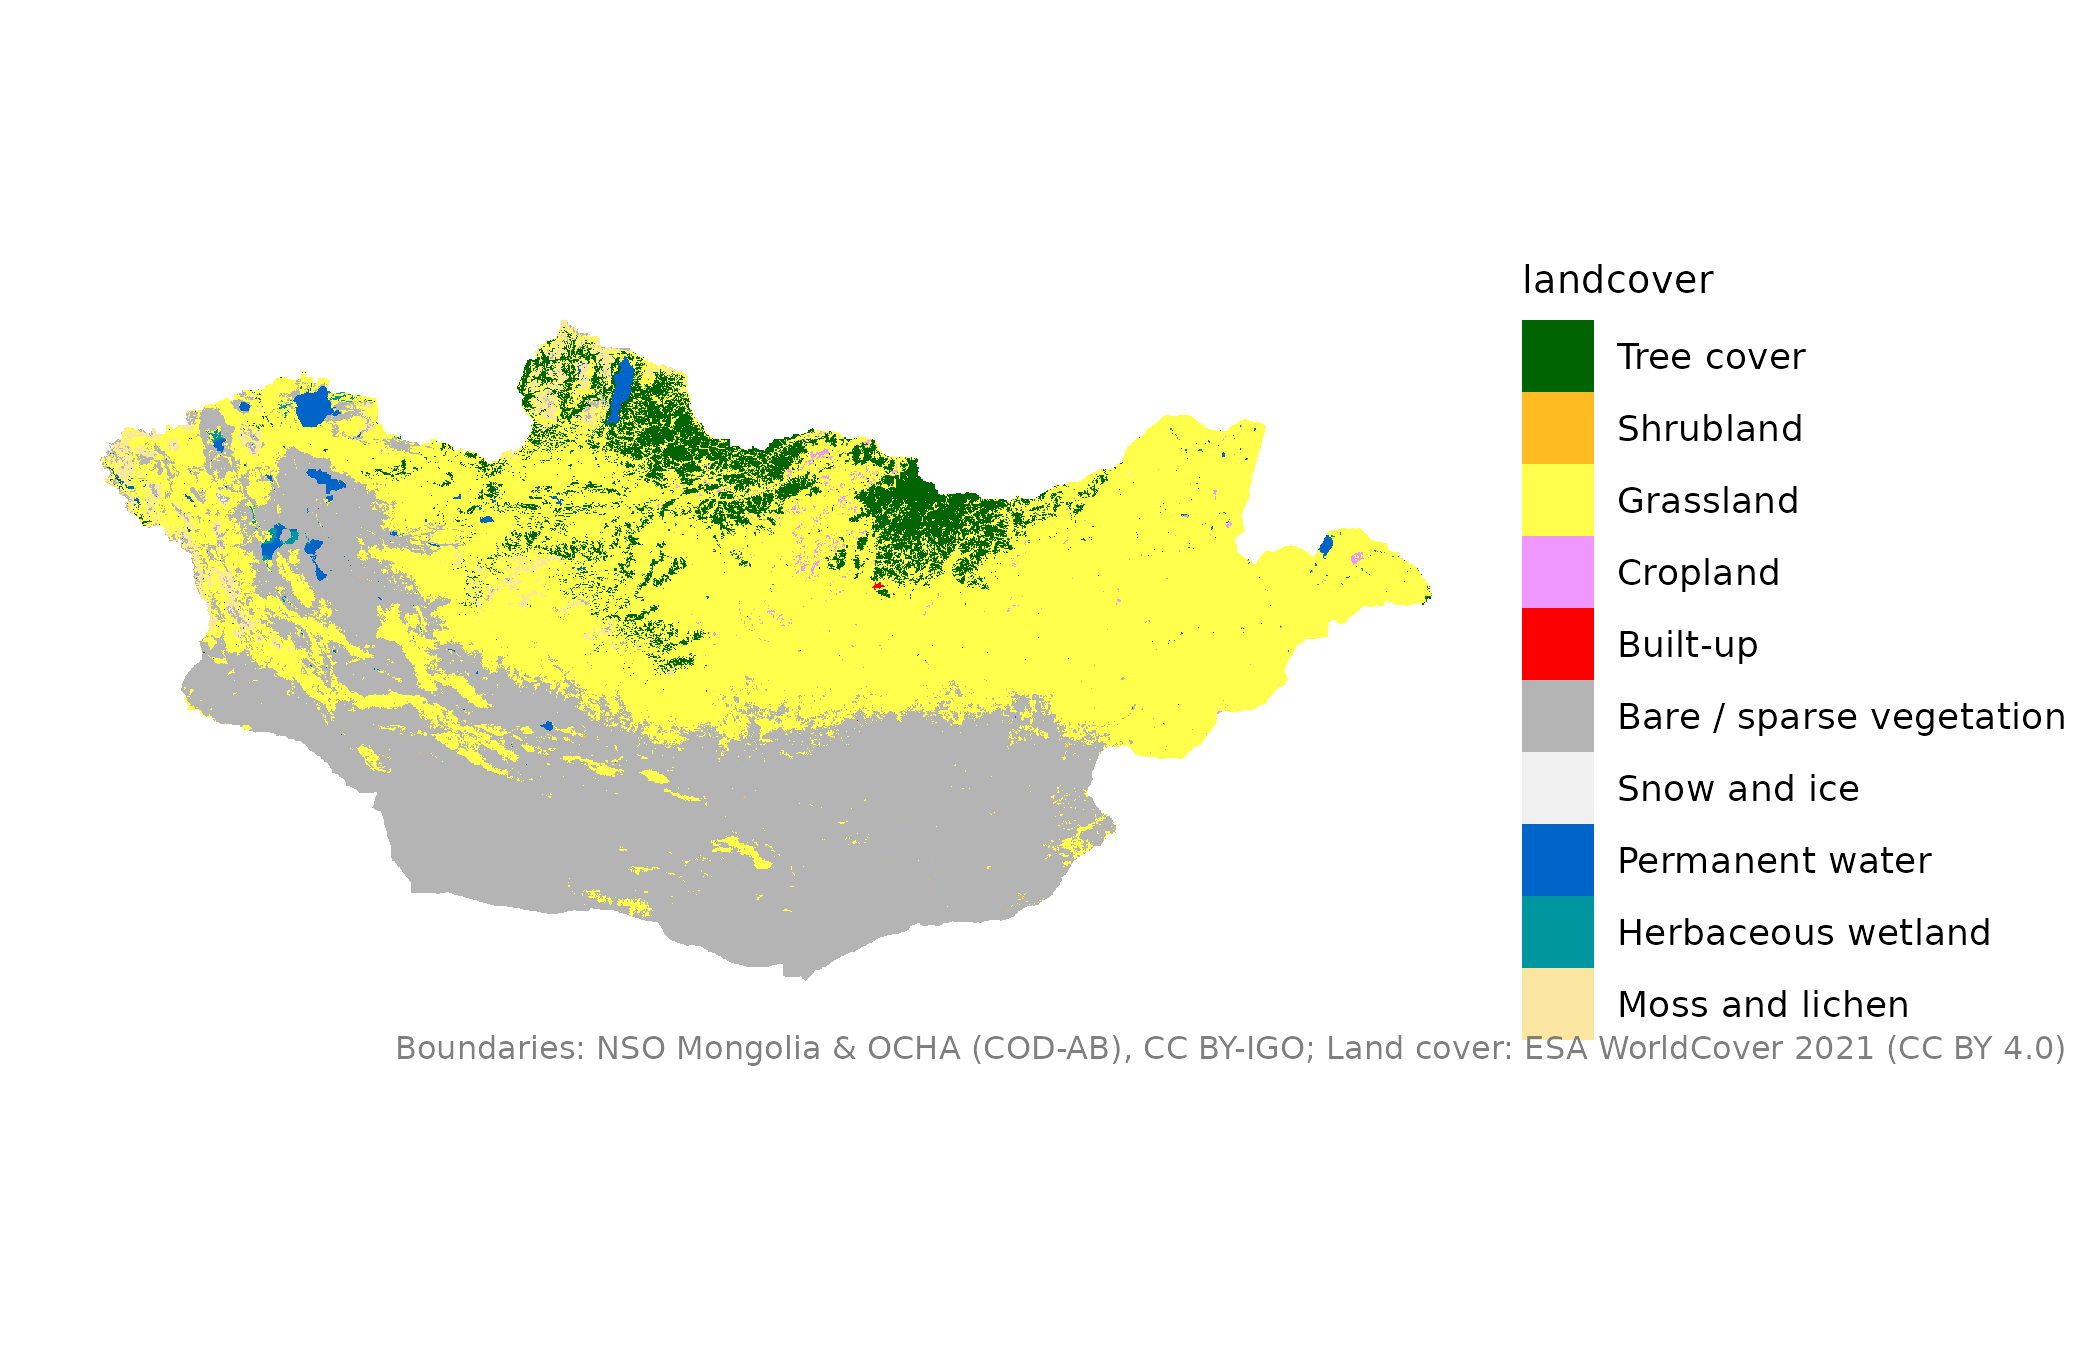
 mn_map(mn_landcover())
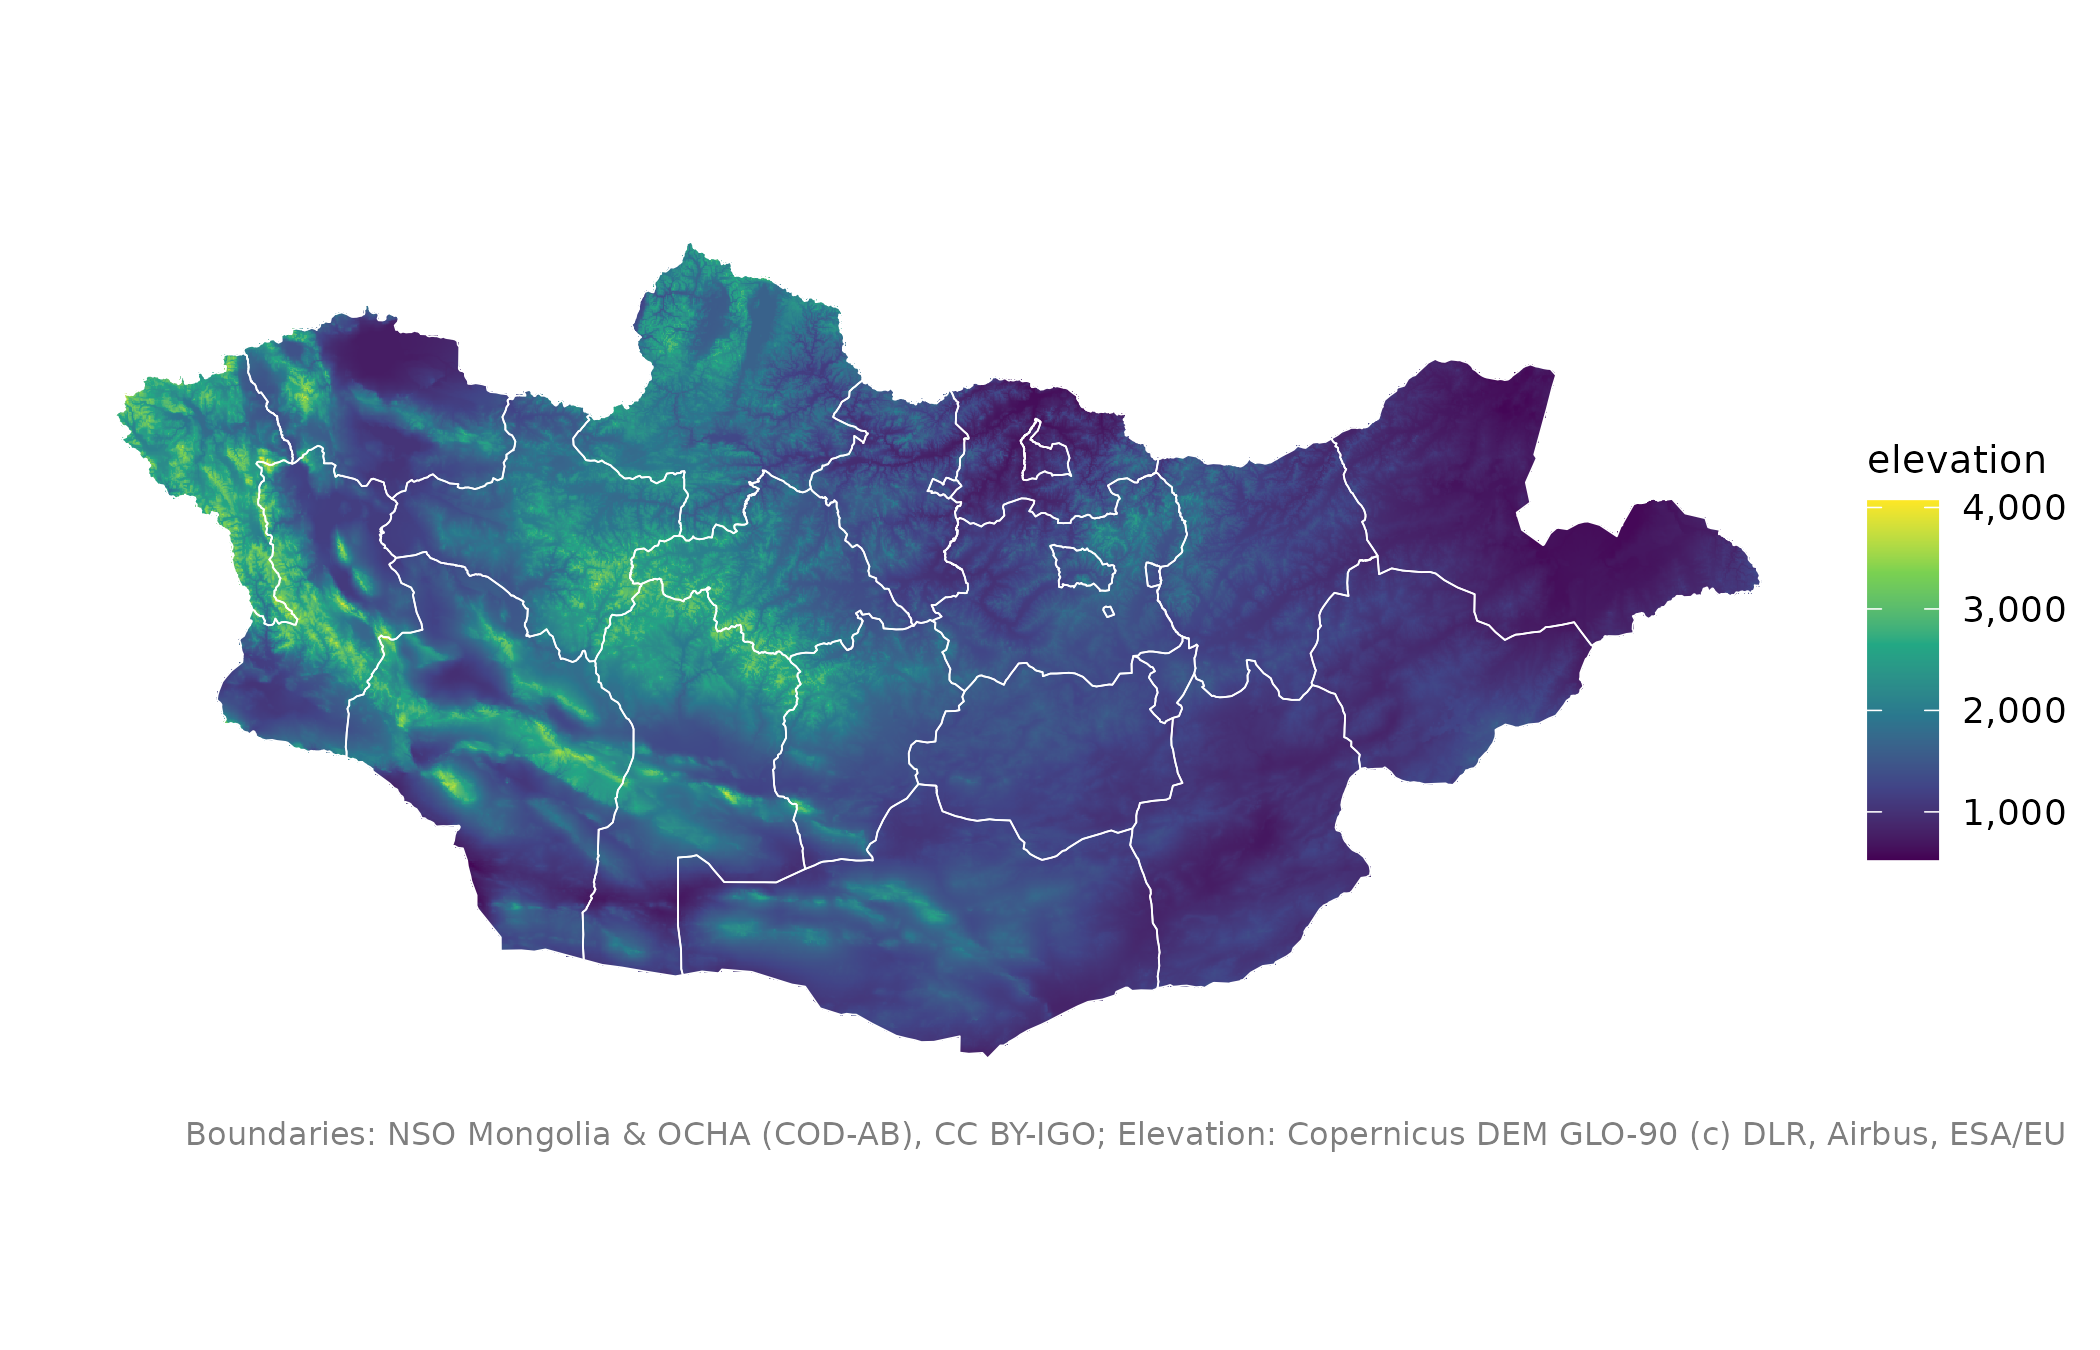
 mn_map(mn_elevation()) + ggplot2::geom_sf(data = mn_aimags(), fill = NA, colour = "white")